The States and Cities with the Most Affordable Electricity Bills

Rising bills are one of life’s certainties — but how they rise is in constant flux. For now, the U.S. Energy Information Administration forecasts moderate price rises in retail electricity across 2025. The average household will see their bill grow by 2% — more or less in line with inflation. But this comes after a half-decade (2019-2023) when prices rose an average of 4.8% annually.
The situation is particularly acute as we are poised on the brink of a new era in electricity supply. A 2024 report from Energy Innovation found that recent domestic energy bill rises are due to the cost of wildfire mitigation, rising infrastructure costs and “big capital expenditures” such as maintaining outdated coal plants. Meanwhile, RMI experts report that solar power, “the cheapest energy source in history,” could be on track to become 50% cheaper by 2030. However, modernizing America’s electric grid comes with its own costs and challenges.
Meanwhile, those price hikes are far from even across the U.S. landscape — particularly when compared to local income levels. CashNetUSA used Census Bureau data to find the states and cities where electricity costs the most in absolute terms and compared to the average local income.
What We Did
We analyzed data from the U.S. Census’ Public Use Microdata Sample to determine the states and cities where households spend the most and least annually on average on electricity. Then, we compared these figures to local average household incomes to calculate the relative affordability of electricity in each location.
Key Findings
- Fresno, CA, has America’s highest electricity bills, at an annual average of $3,123 per household.
- The state with the highest electricity bills is Connecticut, with an annual average of $2,496.
- Seattle is the city with the most affordable electricity bills, with the average annual outlay costing 1.24% of the local average household income.
- In Detroit, a year of power costs 5.74% of the average annual household income, making it the least affordable city for electricity.
Connecticut Households Spend $2,496/Year on Electricity — the Most of Any State
First, we compared the average electricity bill in every state around the U.S. In Connecticut, the average annual bill is $2,496 — around $1,000 more than in Idaho, Wyoming, Utah or Vermont.
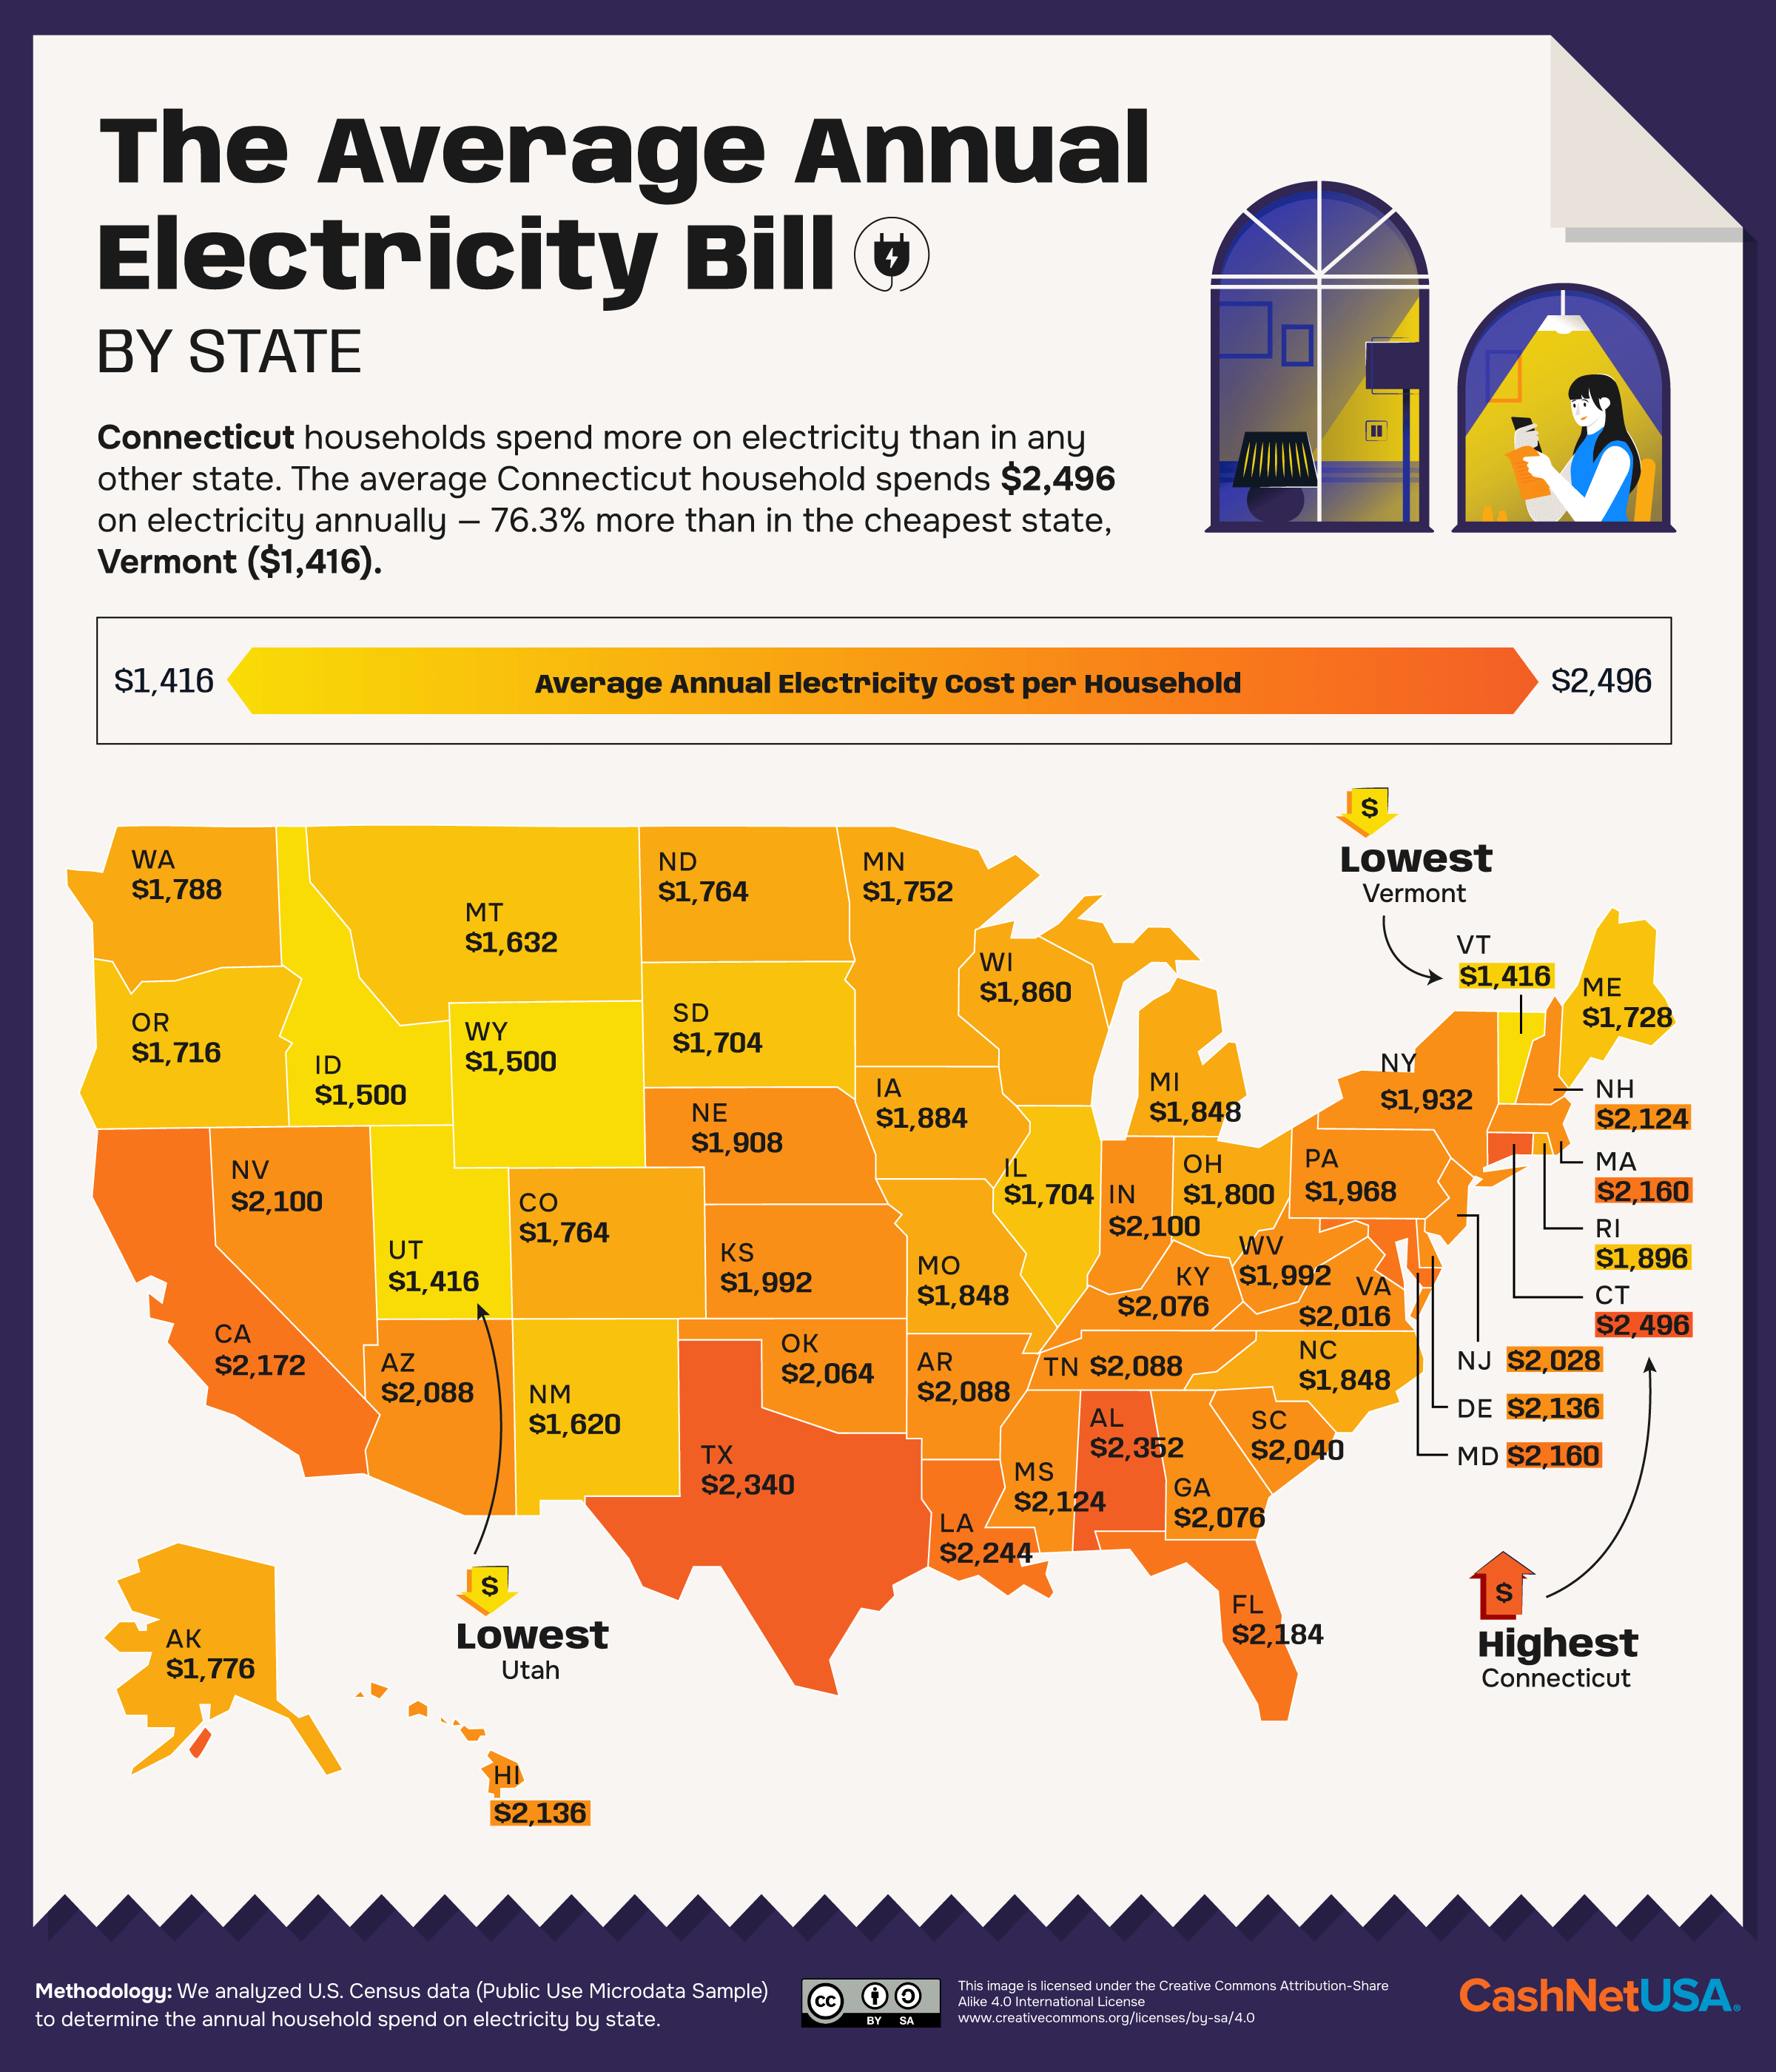
Local utility firms blamed a July 2024 spike in Connecticut’s prices on the cost of state-required and approved programs and policies. Senator Norm Needleman warned of the need to face up to electricity prices only as part of a rigorous energy plan: “Certainly, we would want to look at such issues as the cost of electricity, the reliability of its delivery of it and how we will seek to continue to meet the state’s air quality,” he told a special session last summer.
However, Connecticut’s electricity bills are not high enough to qualify them as one of the least affordable states. That title goes to Louisiana, where the average annual bill costs 4.05% of the average household income.
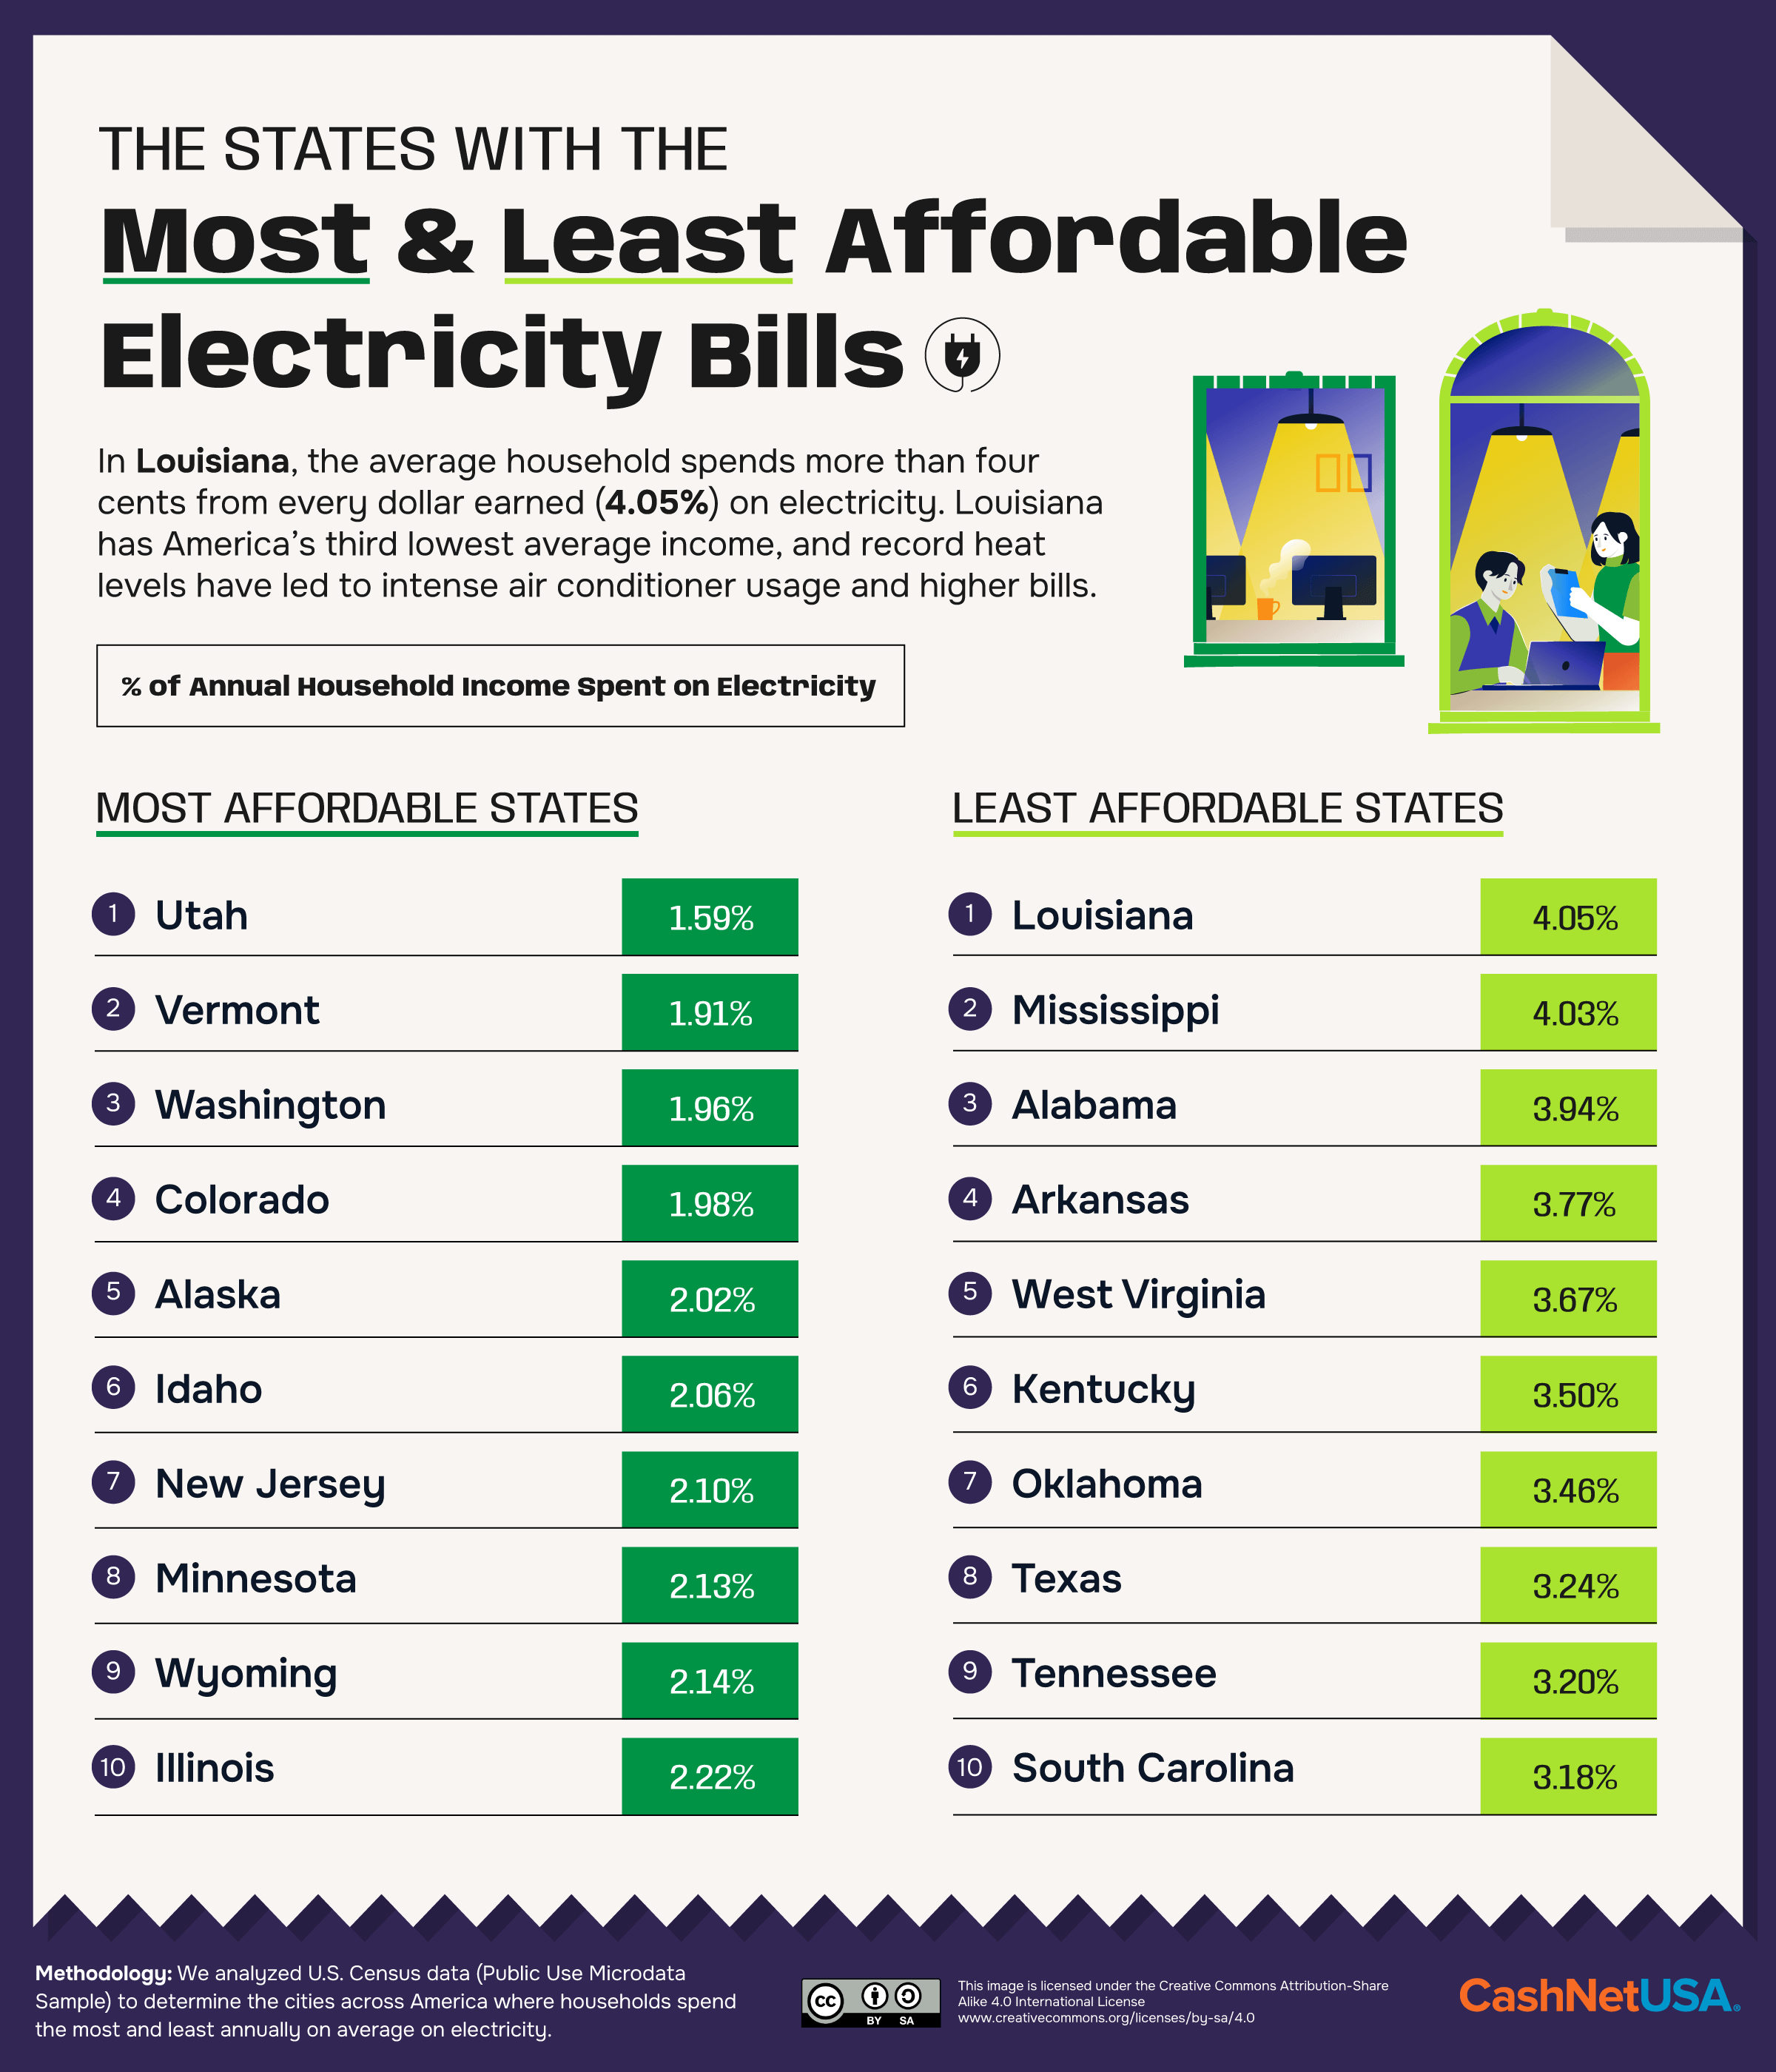
Even allowing for natural disasters, Louisiana has the most outages for the longest periods of any southern state. But those natural disasters also have a major impact, with 47 incidents in the decade to May 2024 costing a total of over $1 billion.
Entergy Louisiana reduced or eliminated fees for late payments and reconnections in 2024 and adjusted eligibility factors to allow more low-income seniors to qualify for bill discounts, while also raising prices in general. However, the U.S. Energy Information Administration found that electricity costs in New Orleans are rising at twice the national average rate.
California and Texas Cities Face Highest Electricity Bills
Next, we compared the average electricity bills and relative affordability in America’s 100 most populated cities. The top ten cities with the highest annual bills are clustered in Texas and California, with the Californian cities of Fresno ($3,123), Bakersfield ($2,928) and Stockton ($2,790) taking the top three places.
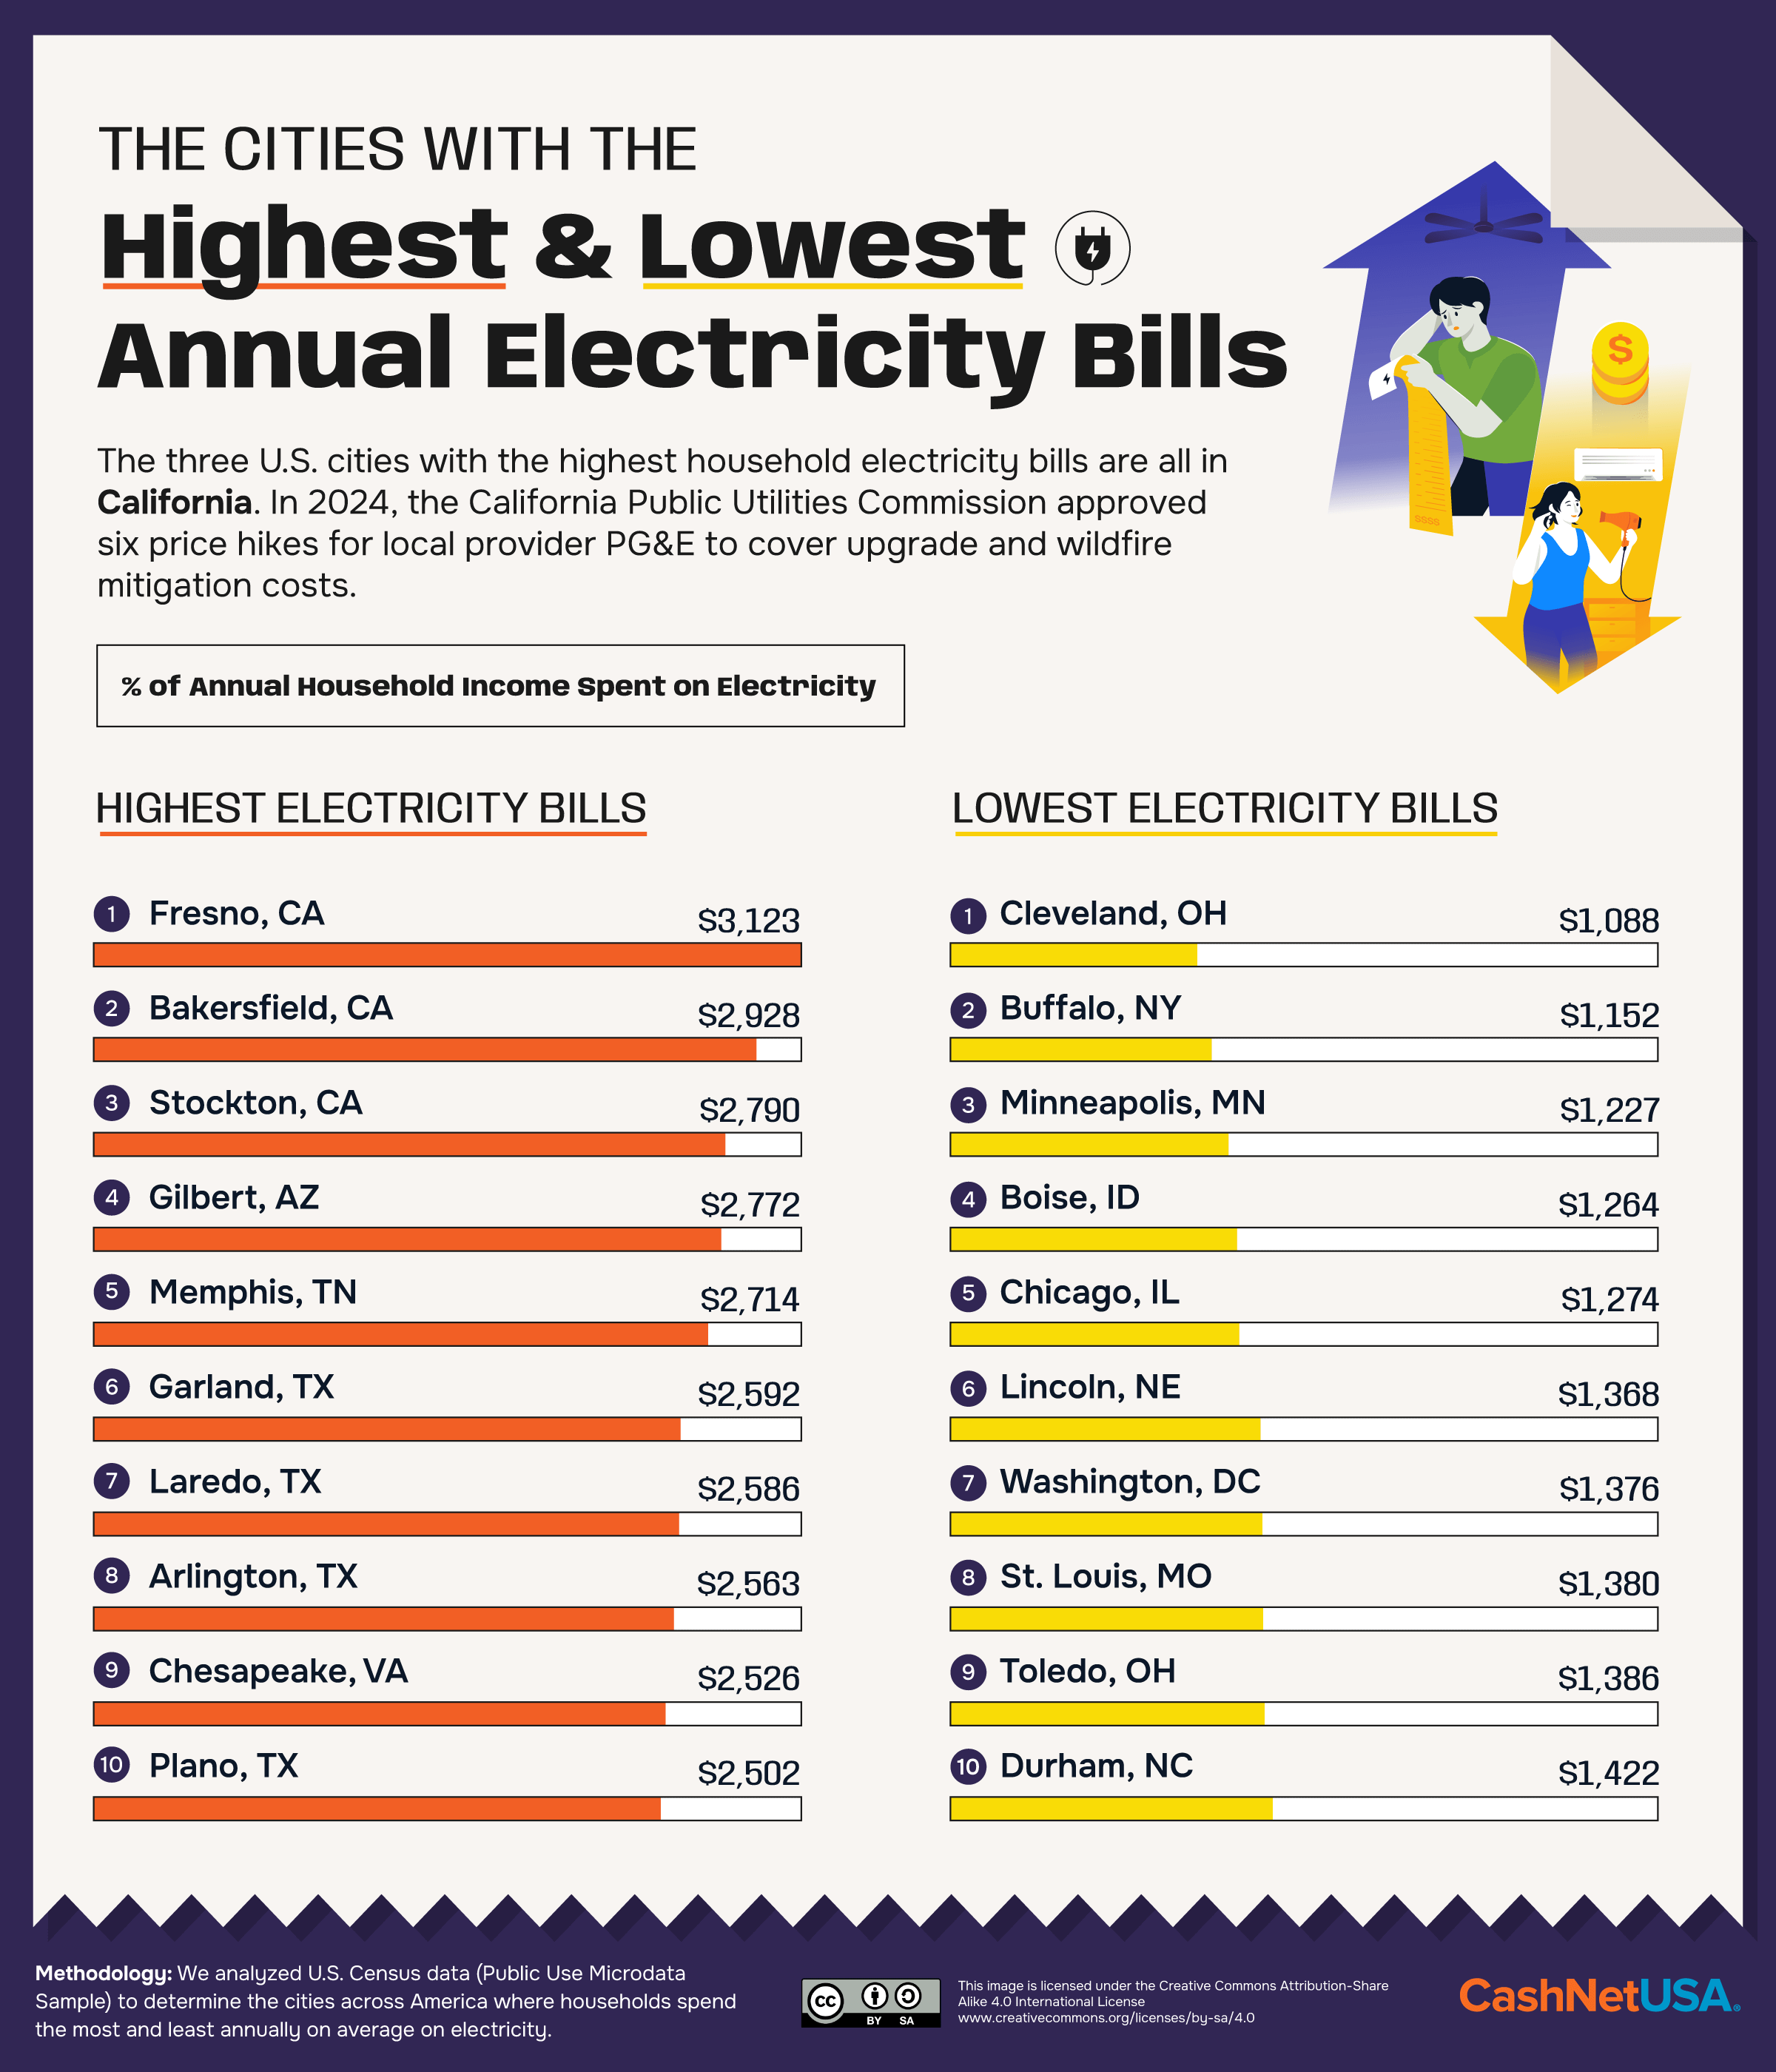
California’s Pacific Gas and Electric Company (PG&E) increased prices six times across 2024, with the Utility Reform Network claiming that customers were paying an extra $50 monthly by the end of the year. PG&E attributes the hikes to power plant expansions and wildfire relief and mitigation.
However, customers felt these costs should come from PG&E’s profits. “This rate increase is to cover last year’s cost overrun,” Mary Zhu, 84, told a meeting of the California Public Utilities Commission. “…A company with $15 billion in the bank is not entitled to charity.”
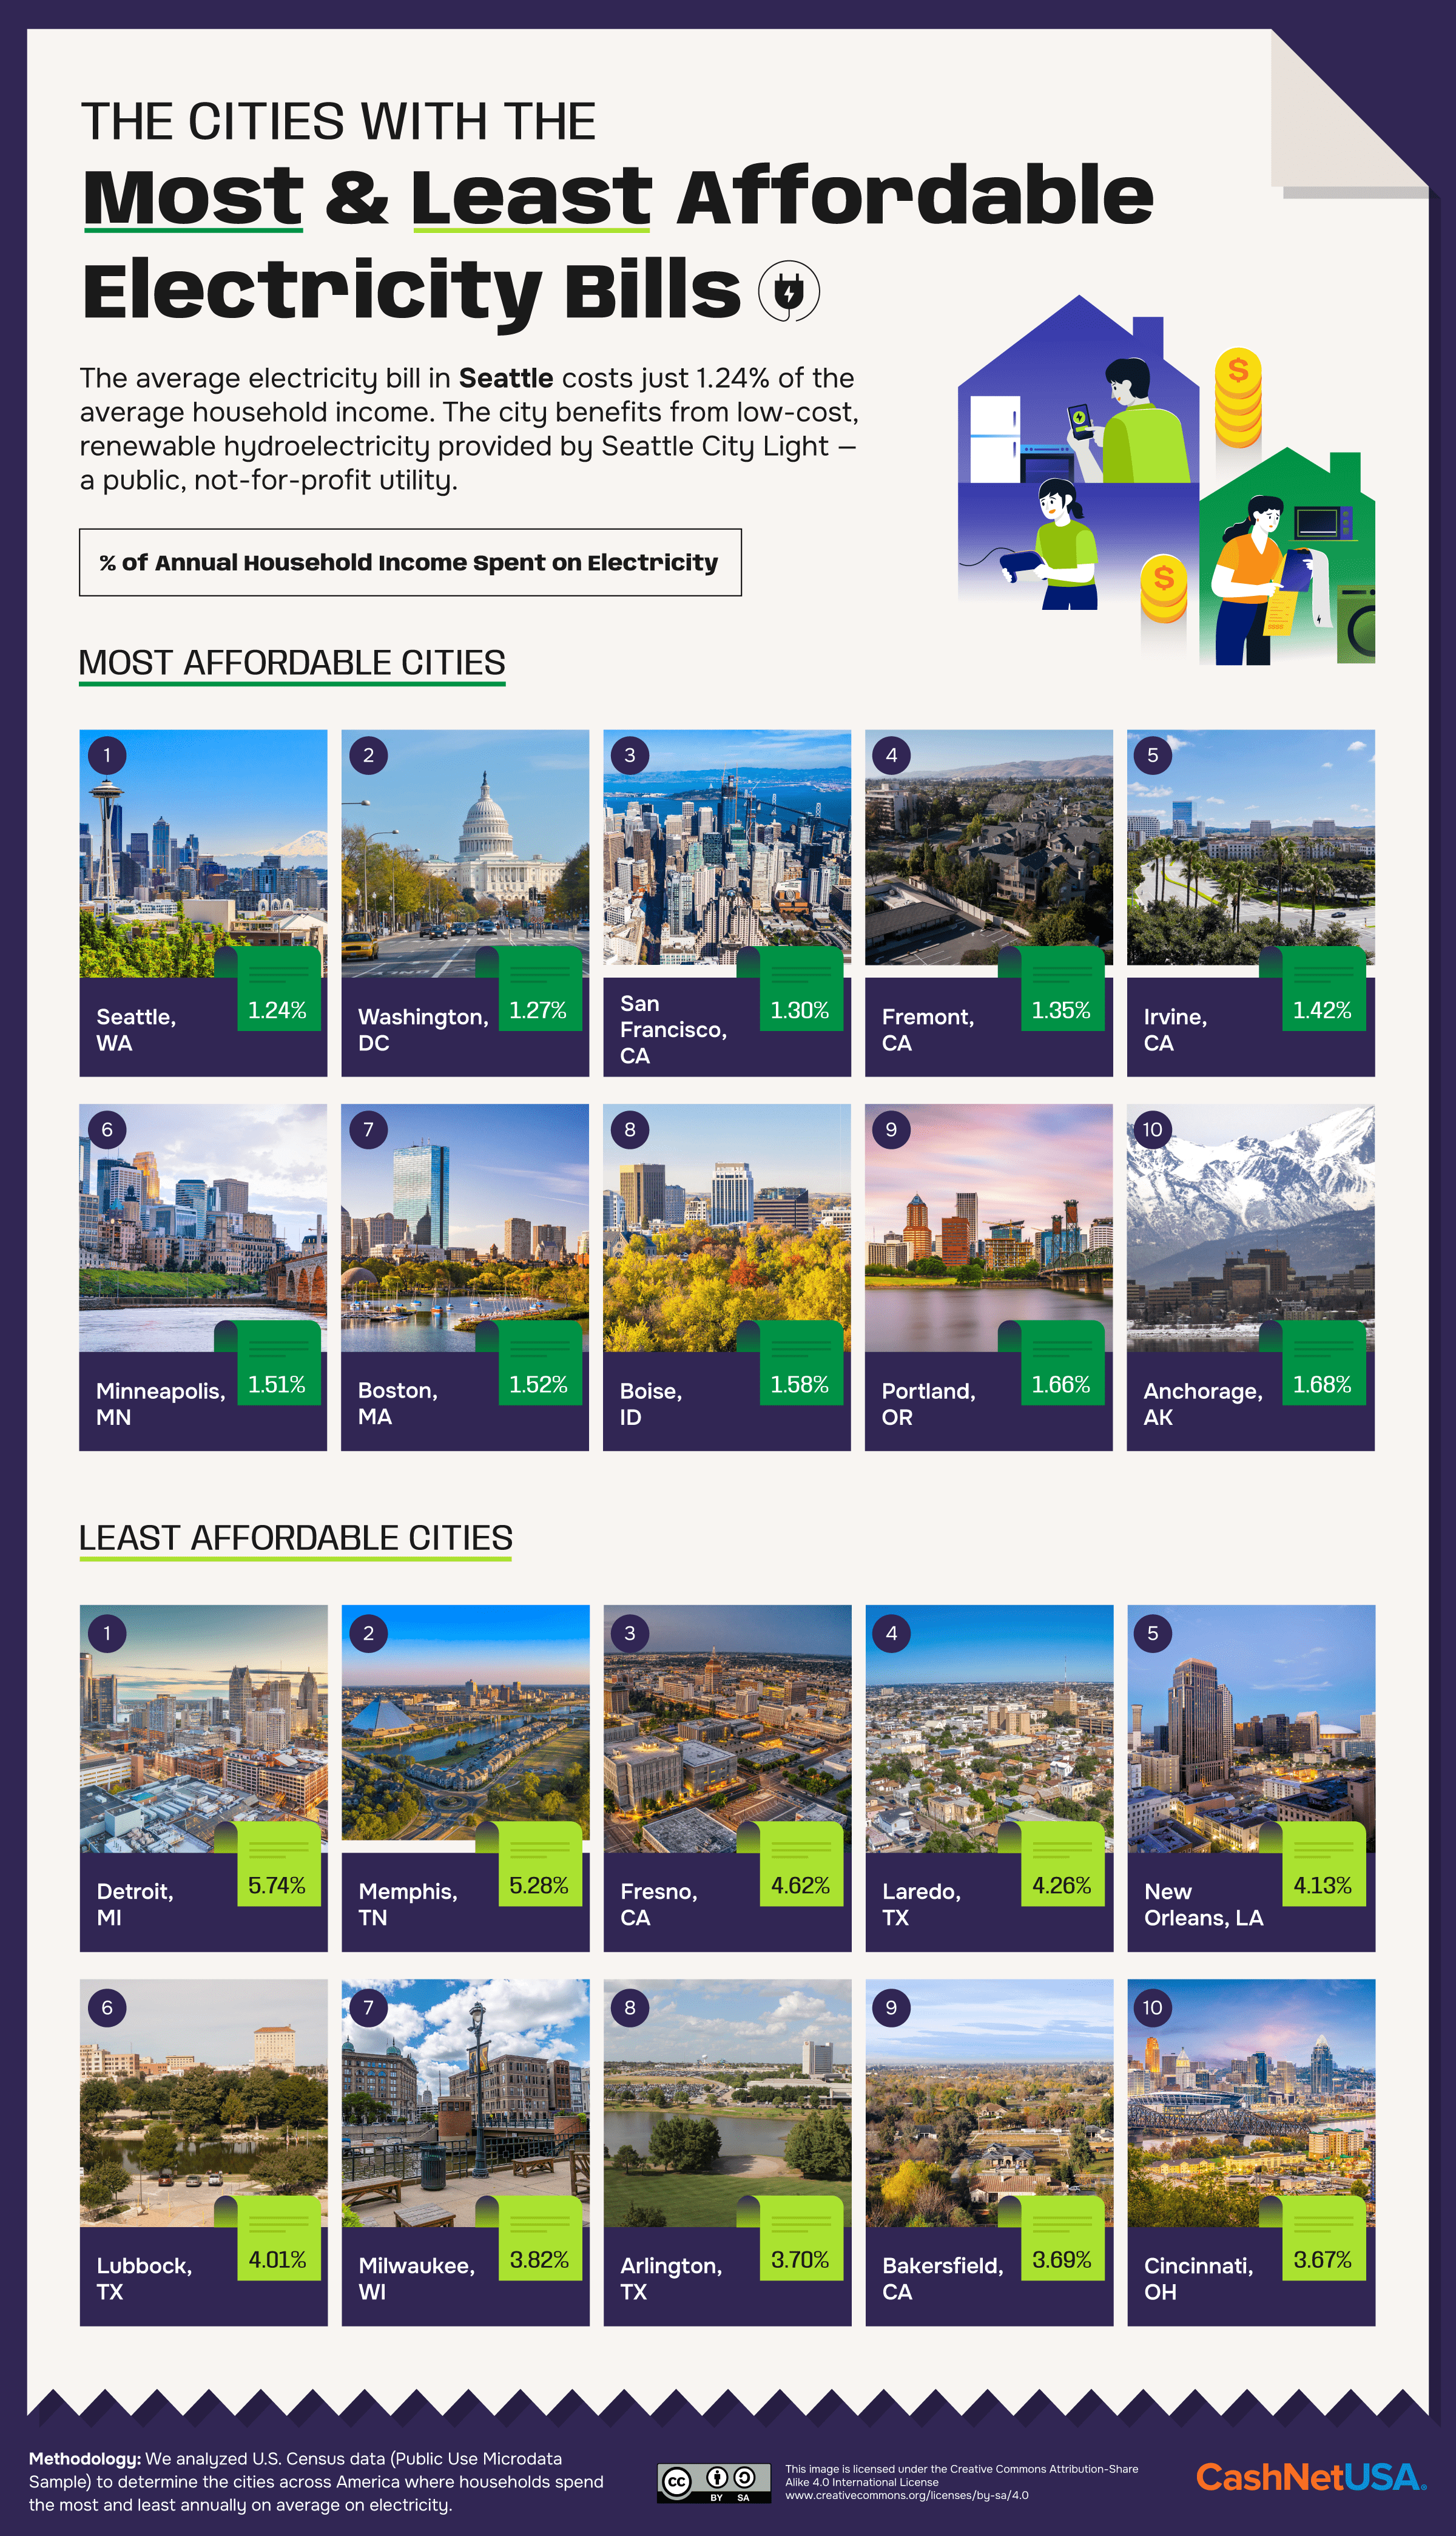
Despite the unrivaled electricity costs of these Californian locations, the average local income keeps them out of the top ten least affordable cities. This is not the case for Laredo and Arlington, which are two of four Texas cities among the ten most expensive and three Texas cities among the least affordable when comparing electricity bills to local incomes.
In Laredo, the average annual bill is $2,586, or 4.26% of the average household income. The city is covered by the Webb County Community Action Agency, which provides bill relief to some low-income families through its Comprehensive Energy Assistance Program (CEAP).
Passing the Costs
The energy landscape is changing, along with opportunities for new technology, threats of wildfire and increased A/C dependency. But solar and wind power are technology-oriented, rather than resource-oriented. So, while dwindling fossil fuels are likely to rise in cost, solar and wind may get cheaper as designers embrace the “learning curve” of developing new technologies.
However, combined with wildfire mitigation and the maintenance of outdated fossil fuel infrastructure, modernizing is a cost that firms are passing on to customers. Some are even lobbying for customers to continue paying for electricity they won’t actually use due to the success of energy efficiency programs. While rising prices may cost America’s neighborhoods unevenly, every paying customer has a voice — and many may also be able to switch to a provider who puts customer needs first.
Methodology
We analyzed data from the U.S. Census’ Public Use Microdata Sample to determine the states and cities across America where households spend the most and least annually on average on electricity.
In addition, we calculated affordability by location based on the average percentage of annual household income spent on electricity, using median household income data from the U.S. Census.
We calculated these metrics for the 100 most populated cities in the U.S. by mapping the PUMA (statistical geographical areas with less than 100k population) units from the Microdata Sample to their corresponding cities and aggregating the data.
This data analysis was completed in January 2024.
DISCLAIMER: This content is for informational purposes only and should not be considered financial, investment, tax or legal advice.
Related Articles